Clocks and signals run fully asynchronously — no shared timebase forced on anything. Realistic signal state modeling: High-Z, weak drive, glitches, and contention. Arrows, text, timebreaks, and labels that stay attached to what they're pointing at, even as the diagram changes underneath them.
TimeGen models what a signal actually does on a real board: floating when nothing drives it, pulled weakly instead of driven, glitching for an instant, or genuinely contended between two sources.
| State | What it represents |
|---|---|
0 / 1 | Driven low or high |
Z | High impedance — nothing driving the line |
Weak H/L | Pulled, not driven — drawn at half strength |
HL | Contention or don't-care — full-height band |
Glitch | A momentary spike that snaps back automatically |
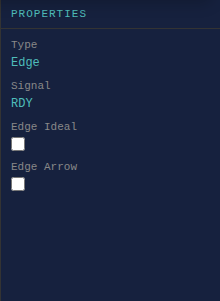
Every transition between states can be ideal — a clean vertical edge — or non-ideal, drawn with a real slope to represent a transition that actually takes time. Set the default per signal, or override it on any single edge.
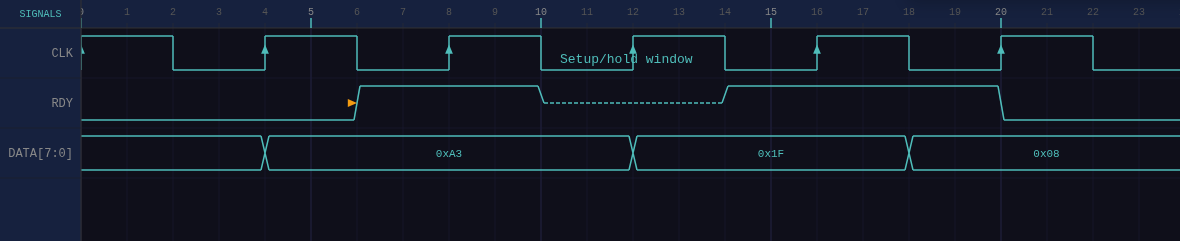
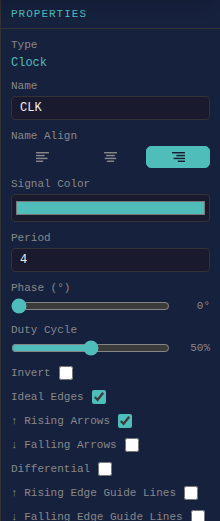
A clock is defined by period, phase, duty cycle, and polarity. Change any of them from the properties panel, or just grab the clock's own waveform on the canvas and drag it left or right: the phase value updates live as you move, no dialog box in the way.
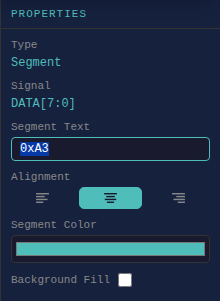
A bus segment holds any text you type, shown right inside the segment. Click a segment and its value field focuses immediately, so you can click through a whole row of segments and just keep typing, one value after another, without a single extra click to get into the text box.
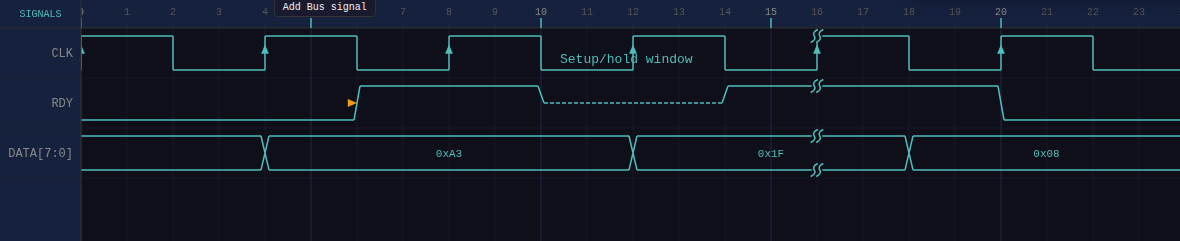
Every transition shows an uncertainty crossing mark by default, the same convention used in real datasheets — or a clean vertical line if you mark that edge, or the whole bus, as ideal.
Document the relationship between signals, not just the signals themselves. Draw a straight arrow, a bezier curve for anything that isn't in a straight line, an interval bracket that calculates the time between two points automatically, or drop a free text box anywhere on the canvas.
Snap an annotation's endpoint to a real signal edge when you draw it, and it stays attached — drag that edge to a new time later, and the arrow (and the interval's calculated time difference) follow automatically instead of being left pointing at the wrong spot.
Add a time break to show a gap in the timeline — the standard broken-line convention — instead of drawing out a long boring stretch at full width. Apply it to a single row, or to every row in the diagram at once, and it automatically matches whichever rails that row actually uses.
| Format | Best for |
|---|---|
SVG | True vector — crisp at any zoom, editable in Illustrator or Inkscape |
PDF | Vector, built for print and datasheets |
Ctrl + C copies the diagram straight to your clipboard — paste it directly into Word with no export step at all.
Set a prefix, suffix, starting value, and increment for the time ruler — label your diagram in ns, cycles, or whatever unit the spec actually uses.
Zoom into a dense transition or out to see the whole diagram at once — panning and zooming stay smooth even as a diagram grows.
Work in a dark theme for long sessions or switch to light for screenshots and presentations — your diagram's colors adapt automatically.
Free to start — the full editor, every feature on this page, no watermark.