User's Manual
A complete reference for every TimeGen 5 feature — signals, clocks, buses, annotations, time breaks, and export.
Getting started
A new diagram starts empty. Add a clock, a signal, or a bus from the toolbar, and the canvas builds around whatever you add.
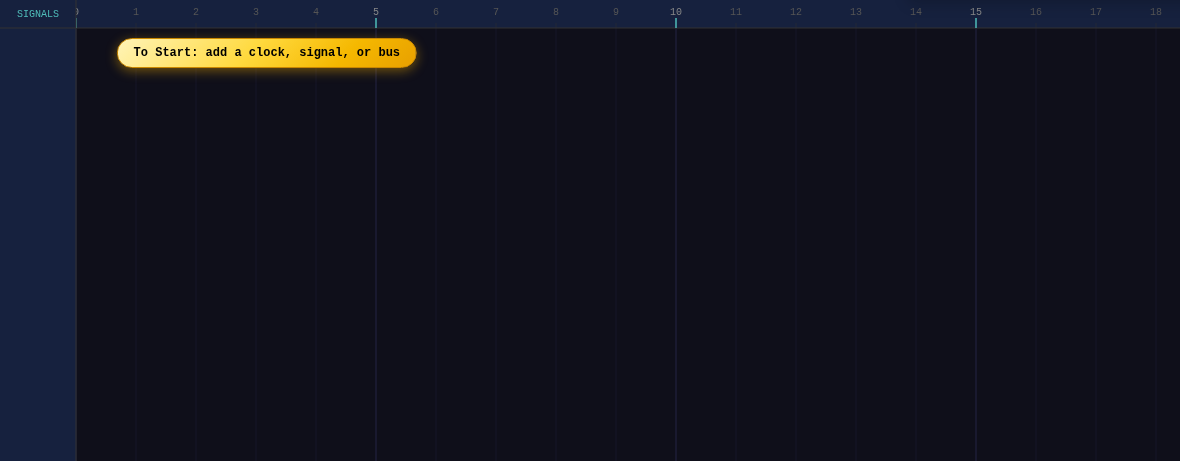
Every row you add — clock, signal, or bus — appears below the last one, with its name on the left and its waveform to the right. Click a row's name to rename it; click anywhere in its waveform area to select it or one of its segments.
The toolbar
Everything you need to build and edit a diagram lives in one row at the top.

| Control | What it does |
|---|---|
+ Clock / + Sig / + Bus | Adds a new row of that type at the bottom of the diagram. |
| Select S | The default tool — click to select, drag edges to move them. |
| Text T | Click anywhere to drop a free text note. |
| Arrow A | Click a start point, then an end point, to draw a straight annotation arrow. |
| Bezier B | Same as Arrow, but draws a curve — good for connecting things that aren't in a straight line. |
| Interval I | Draws a bracket between two points with the time difference calculated automatically. |
| Time Break | Marks a horizontal gap in the timeline — useful for skipping a long idle stretch. |
| Zoom +/− | Zooms the timeline in or out. Shows the current zoom percentage. |
| File | New, Load, Save, and Export — see The File menu. |
| Theme | Switches between dark and light — see Themes. |
Signals, clocks & buses
Three row types cover almost everything a timing diagram needs to show.
Signal
A single logic line. Supports every real-world state — not just high and low — including high-Z, weak drive, glitches, and Both-High-and-Low. See Signal states.
Clock
A periodic square wave defined by period, phase, and duty cycle, rather than hand-drawn transitions. See Clock properties.
Bus
A multi-bit value shown as text (hex, binary, or a plain label) inside each segment, with an uncertainty crossing mark at every transition. See Bus values.
Separator
A blank spacer row for grouping — no waveform, just an optional horizontal rule and an internal label.
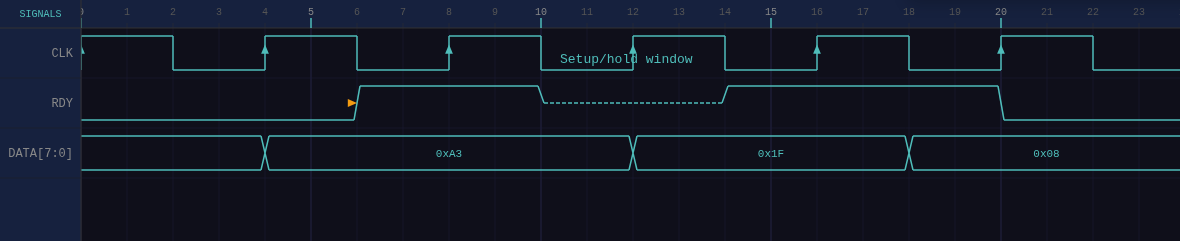
Adding transitions
Signals and buses build up one double-click at a time.
- On a signal: double-click the top half of the row to add a rising transition, or the bottom half for a falling one.
- On a bus: double-click anywhere in the row to add a new segment boundary, then type its value — the text field focuses automatically so you can start typing immediately.
- Clocks don't take manual transitions — their waveform is generated from period, phase, and duty cycle instead.
Signal states
A signal segment can be set to any of these, from the properties panel or by cycling through with repeated clicks.
| State | Meaning |
|---|---|
0 / 1 | Driven low or high — the two ordinary logic levels. |
Z | High impedance — nothing is driving the line. |
Weak H / Weak L | Pulled rather than driven — drawn at half the normal signal strength. |
HL | Both High & Low — contention or don't-care, shown as a full-height band. |
Glitch | A brief, unintended spike that snaps back to its original value. |
Each transition can also be ideal (a clean vertical edge) or non-ideal (a sloped edge, representing a real, non-instant transition) — set per-signal as a default, or overridden on any individual edge.
Selecting & editing edges
Click an edge to select it and open its properties — or drag it to move the transition in time.
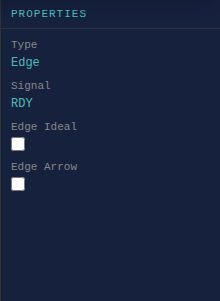
- Drag an edge left or right to move that transition in time.
- Edge Ideal overrides the signal's default for just this one transition.
- Edge Arrow (signals only) shows a small direction arrow on that specific edge, overriding the signal's rising/falling arrow default.
Segment properties
Click inside a segment (rather than on its edge) to select the segment itself.
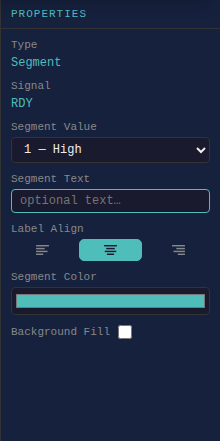
Every segment can carry its own fill color, fill style (solid, hatch, or crosshatch), and opacity — independent of the row's own color. A signal segment can also carry a short optional text label, shown just above the waveform.
Clock properties
A clock is defined entirely by its parameters — there's nothing to manually draw.
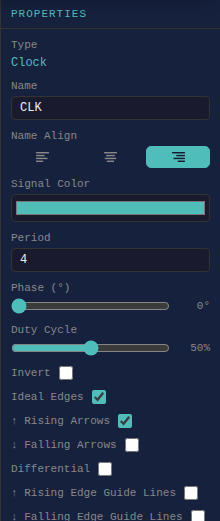
| Property | What it controls |
|---|---|
| Period | The time between one rising edge and the next. |
| Phase | Shifts the whole waveform left or right in time, shown as 0–360°. |
| Duty Cycle | What fraction of each period the clock spends high. |
| Invert | Flips which half of the period is high vs. low. |
| Rising / Falling Edge Guide Lines | Draws a dashed vertical line down the diagram at every rising or falling edge — handy for lining up other signals against this clock. |
Bus values
A bus segment's value is free text — hex, binary, ASCII, or a plain label, whatever makes sense for what you're documenting.
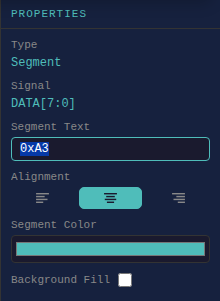
Every transition between two segments shows an uncertainty crossing mark by default (non-ideal) — or a clean vertical line if you mark that specific edge, or the whole row, as ideal.
Arrows, curves & notes
Annotations document the relationship between signals — not just the signals themselves.
| Tool | Use it for |
|---|---|
| Arrow A | A straight line between two points, with an optional label. |
| Bezier B | A curved line — useful when a straight arrow would cross through other signals. |
| Interval I | A bracket between two points that calculates and displays the time between them automatically, updating live if you move either end. |
| Text T | A free-floating note, or one attached to a specific signal so it moves along with it. |
Arrow, bezier, and interval endpoints snap to real signal edges when you draw them — so if you later drag that edge to a new time, the annotation follows it automatically instead of being left pointing at the wrong spot.
Time breaks
Skip a long idle stretch without stretching the whole diagram to show it.
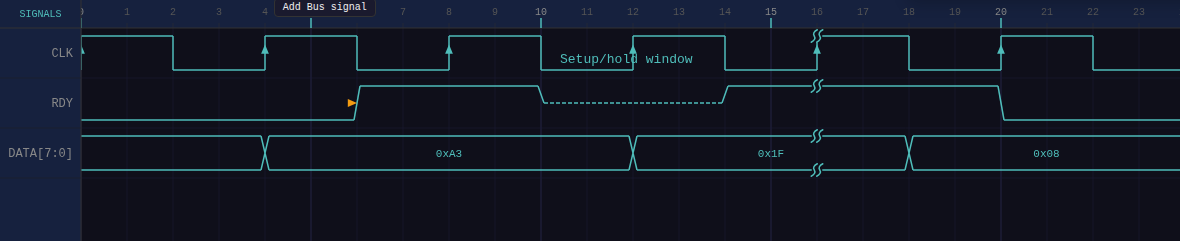
A time break can apply to a single row or, held with Shift while placing it, every row at once — matching whichever rails that row actually uses (a single line for a signal, both rails for a bus or a Both-High-and-Low segment).
Undo, redo & shortcuts
| Shortcut | Action |
|---|---|
| Ctrl + Z | Undo |
| Ctrl + Shift + Z / Ctrl + Y | Redo |
| Delete / Backspace | Delete whatever's selected |
| Ctrl + C | Copy the whole diagram to your clipboard as an image — paste directly into Word |
| Esc | Cancel the current drag or in-progress annotation |
| Arrow keys | Nudge a selected text note by one pixel |
Themes
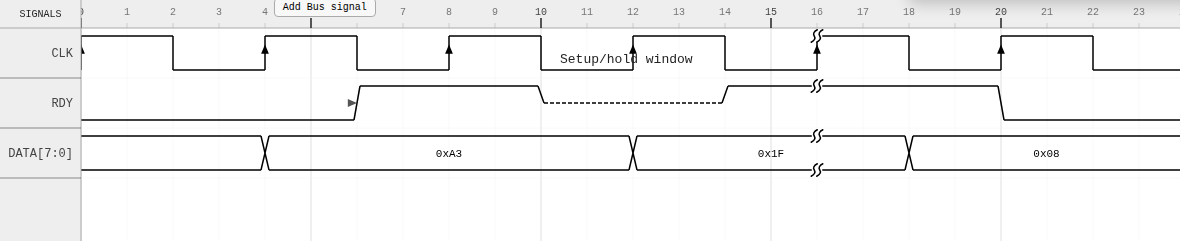
Switch between dark and light from the toolbar — everything, including every signal color, adapts.
Free & paid plans
| Plan | Includes |
|---|---|
| Free | The full editor — every signal type, state, and annotation tool. Up to 5 signal rows per diagram. Export to SVG, PDF, and PNG. |
| Paid | Everything in Free, plus unlimited signal rows and Save/Load so you can come back to a diagram later. |